Who publishes what
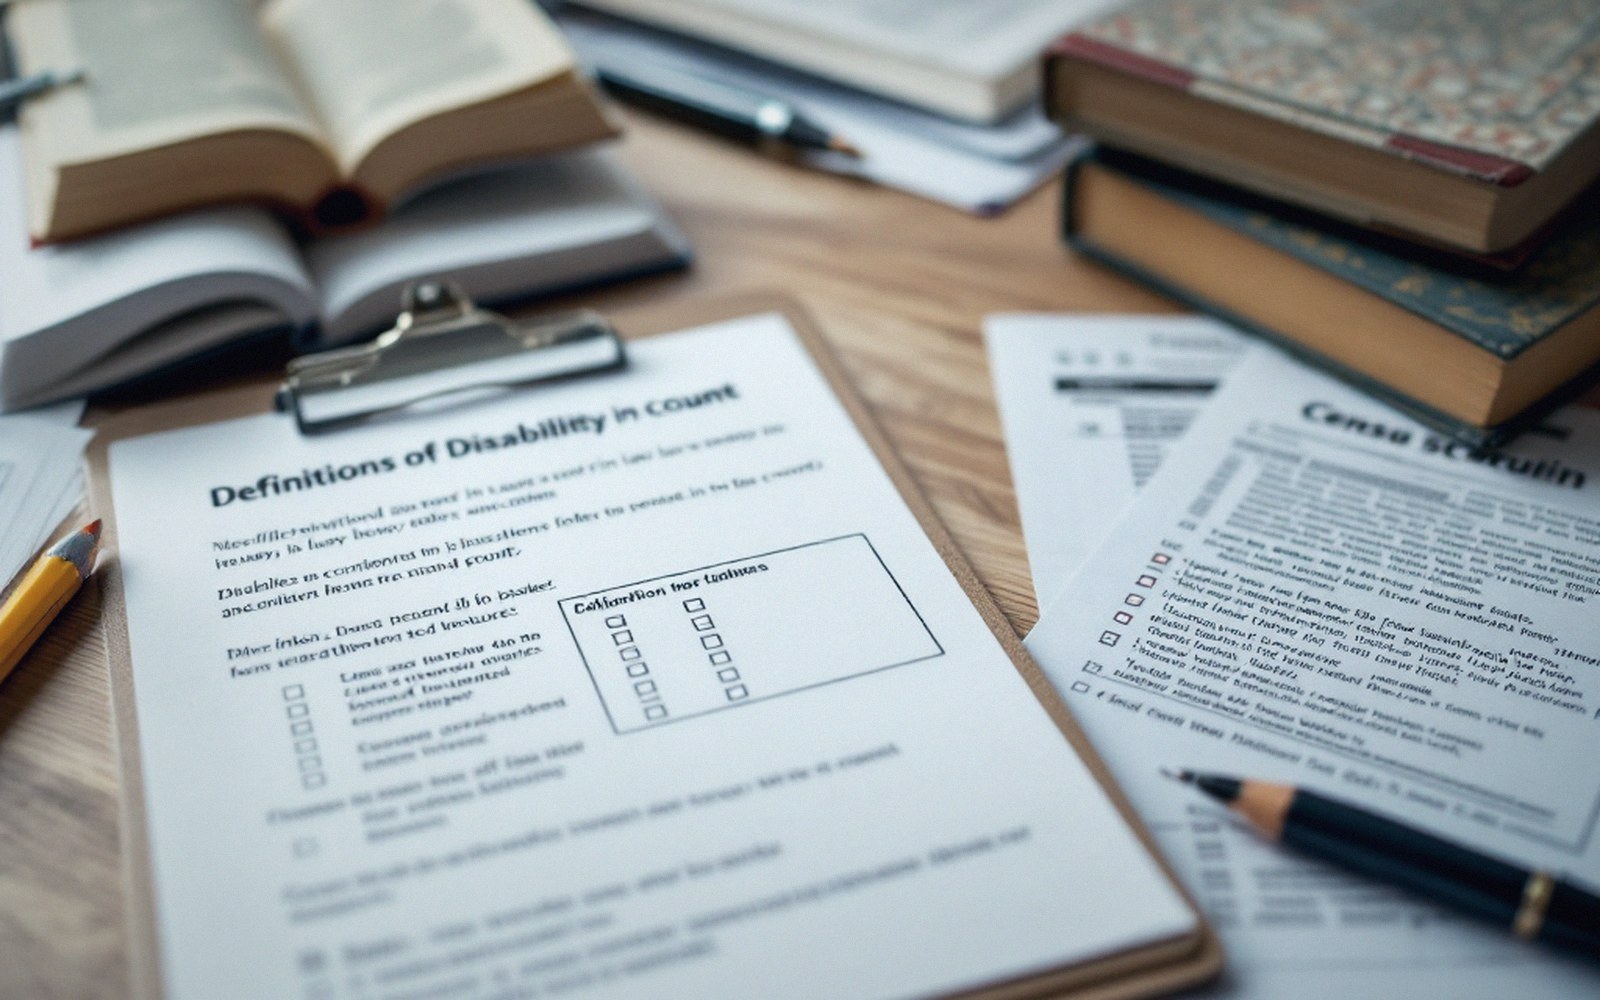
Several bodies publish disability figures. They use different instruments, different populations and different schedules — and the name of the source is not optional.
The publishers and their instruments
The Office for National Statistics publishes disability prevalence figures drawn from the Annual Population Survey, a continuous household survey large enough to produce estimates at regional level. The APS asks respondents whether they have a condition or illness that has lasted, or is expected to last, 12 months or more, and whether it reduces their ability to carry out day-to-day activities. Those two filter questions together produce the headline prevalence figure that appears in ONS bulletins, usually released in the spring for the previous calendar year. The Quarterly Labour Force Survey feeds into the same data infrastructure and underpins the disability employment figures published by the Department for Work and Pensions in its Stat-Xplore tool, though both series carry confidence intervals wide enough to matter for small subgroups.
The Department for Work and Pensions is itself a large producer of disability statistics, but its primary counts are administrative rather than survey-based. Its published data on Personal Independence Payment, Disability Living Allowance and Employment and Support Allowance are counts of claimants — people who have gone through a functional assessment and been awarded a benefit. That population is not the same as the prevalence population measured by a household survey, and the two should not be added together or treated as overlapping estimates of the same thing. DWP publishes caseload statistics quarterly, broken down by age, condition and geography, on a fixed schedule that differs from the ONS survey release calendar.

Photo: Mikhail Nilov / Pexels
NHS England and the NHS in the devolved nations publish data from health surveys — the Health Survey for England, the Scottish Health Survey, the Welsh Health Survey — that include disability-related questions, sometimes with different wording from the APS. These series are designed primarily to support health-needs planning rather than labour-market analysis, and their samples and reference periods do not always align with ONS releases. Figures from the Health Survey for England cannot straightforwardly be compared with APS figures even for the same year.

The Equality and Human Rights Commission publishes its own periodic analysis — most prominently in its Is Britain Fairer? reports — drawing on multiple underlying sources. These are secondary analyses rather than primary data collections. The Commission does not run its own survey instrument; it synthesises existing series, which means the quality of its disability figures depends on the quality and comparability of those underlying sources.
Schedules, lags and revision cycles
No two publishers work to the same calendar. ONS APS-based releases typically refer to data collected in the previous year; DWP administrative series can be more current because they reflect live caseload, but they capture only the assessed population. The Census, conducted by ONS once a decade (most recently in England and Wales in 2021), provides a near-complete population count with a single disability question, but its figures are a snapshot in time and cannot track annual change. Understanding the continuous surveys alongside administrative sources is essential for anyone reading a trend line.
Revisions add another layer. ONS reweights APS estimates when population estimates from the Census are updated; DWP may revise caseload figures when recording errors are corrected. A figure published in one year may change in a subsequent release. The bulletin that first published it will not always be updated; the revision appears in the next release, flagged in a footnote.
Why the source name is not decoration
A disability employment rate published by DWP and one derived from ONS APS data are not the same statistic dressed in different clothes. They may use the same definitional framework — both now use the Equality Act 2010 self-reported measure — but the survey instruments differ, the populations differ and the reference periods differ. Quoting a figure without naming the source, the instrument and the year leaves the number unverifiable and potentially misleading. Citing a figure correctly — source, table reference, year — is the minimum requirement for a number to carry any evidential weight.

Photo: Anete Lusina / Pexels
Threshold is an independent publication about disability statistics and governance. It is not an advice, advocacy or support service and does not interpret law or guidance for individual circumstances.