Reading a bulletin
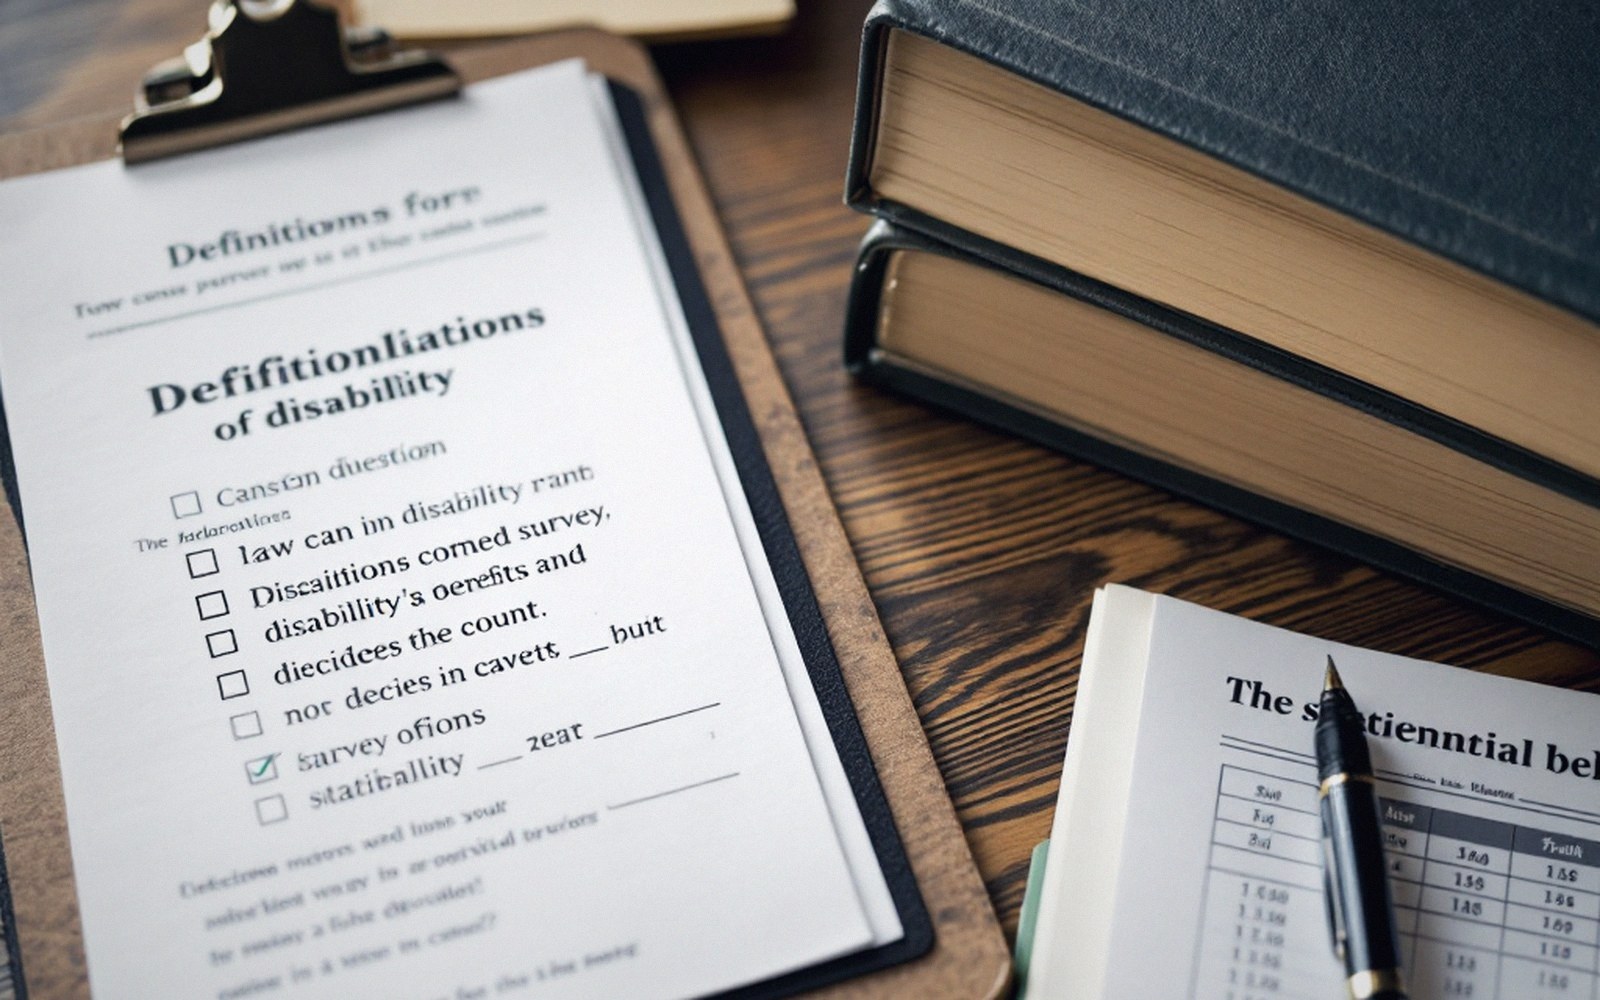
The headline is the least informative part of a statistical release. The caveats are where the thinking is.
Where to find the substance
A statistical bulletin from the Office for National Statistics, the Department for Work and Pensions, or any devolved statistics body follows a predictable architecture. The headline figures appear first — an employment rate, a prevalence estimate, a gap measured in percentage points. These are the numbers that travel into parliamentary questions and press releases. Below them, often many pages down, sit the sections that tell you what the headline actually means: the methodology notes, the quality assessment, the comparability caveats, and the list of changes since the last edition.
Reading a bulletin backwards — starting from the methodology annex and working toward the headline — is not perverse. It is the sequence that makes the headline legible. The annex will state which survey supplied the data, the sample size in that reference period, the confidence intervals around the main estimates, and whether any question wording changed between the current release and the previous one. All of that governs whether a reported movement of, say, two percentage points is a real shift or noise within the margin of error.
The sections that do the work
The "changes to this publication" notice is the first thing to check in any release that is part of an ongoing series. It records methodological revisions, re-weighting of the survey sample, and alterations to the question sequence. A series that looks continuous may contain a silent break: the figures either side of a methodological change are not directly comparable, and the bulletin should say so, usually with a note about whether back-series have been revised to restore comparability. If they have not, the trend line in the accompanying chart is more complicated than it looks.
The quality and methodology section tells you which instrument produced the data. For disability figures, that distinction is consequential: estimates derived from the Annual Population Survey rest on a self-report question using the Equality Act framing, while figures drawn from administrative data count people recorded in a particular benefit system. The same bulletin headline can appear from very different source instruments in different years, and the source of the figure shapes its scope and limits in ways the headline table will not signal.

Photo: Mikhail Nilov / Pexels
Confidence intervals appear in the accompanying tables more reliably than in the main text. A figure of 53.7 per cent may carry a 95-per-cent confidence interval of plus or minus 1.2 percentage points. A reported year-on-year change of 0.8 points is then within the interval and should not be described as a confirmed increase. Bulletins from ONS and DWP will generally flag where changes are not statistically significant, but the flag is often a footnote, not the headline.

Photo: Anete Lusina / Pexels
Definitions boxes in disability bulletins carry real weight. Whether the bulletin applies the Equality Act 2010 definition, a broader long-standing illness measure, or a benefits-receipt proxy determines the population being described. These are not equivalent. A bulletin that switches from one definition to another between editions — or that conflates them in a single headline — requires careful attention before its figures can be placed alongside any other series.
The "further information" or "user feedback" section at the close of a bulletin is not administrative padding. It names the responsible statistician and the production team, identifies the next scheduled release, and frequently flags ongoing methodological reviews. A note that a definition is "under review" or that a question change is planned for the next wave is a signal that the current series may break in a future edition — information with direct bearing on how much analytical weight to place on the present figures.
The ONS, DWP, and the devolved statistical authorities all publish their bulletins under the Code of Practice for Statistics, which requires transparency about quality, methods and limitations. The caveats are not there to hedge; they are there because the producing statisticians understand that a number without its context is not a statistic — it is a claim.